There is a version of “the catalog is done” that every SFCC team recognizes. Products are assigned to categories. Variation masters have their variants. Price books are current, inventory syncs, images resolve, the search index rebuilds cleanly. Business Manager shows green.
That state means the catalog is managed. It says almost nothing about whether the product data is good.
Managed and good are different tests
Managed asks: does the platform accept this data and behave correctly with it? Good asks: does this data let a shopper decide to buy, and does it work on every channel it gets sent to?
A product can pass the first test comprehensively and fail the second:
- A description that is one sentence long, or three paragraphs copied from the supplier’s PDF, complete with their part numbering.
- Materials, dimensions or care instructions present on 40% of a category and absent on the rest — so any refinement built on them hides good products.
- Colour values like “Navy”, “navy blue”, “NVY” and “Dark Blue” living side by side in the same attribute.
- One image where the category standard is five, or five images shot against three different backgrounds.
- Attributes populated in the primary locale and empty in the others, so a whole market gets a thinner catalog than it should.
- Bundles and sets that inherit nothing sensible from their members.
None of this stops the platform. All of it stops shoppers.
Why it drifts, structurally
Product data quality does not decay through carelessness. It decays because of how the data arrives.
Feeds come from suppliers, PIM systems, distributors and spreadsheets, each with its own conventions and its own idea of what a colour is. Imports are built to be tolerant, because a strict import that fails on one bad row blocks a whole catalog update — so tolerance becomes the default, and partial data flows straight through. New attributes get added for a campaign and populated only for the products in that campaign. Nobody owns “completeness” as a metric, because it is not one field, it is a policy across thousands of products.
Meanwhile the people who would notice — merchandisers — are looking at products one at a time, in a Business Manager UI built for editing a single record, not for seeing the shape of a whole category.
What to measure
Before improving anything, get an honest picture. The useful metrics are boring and countable:
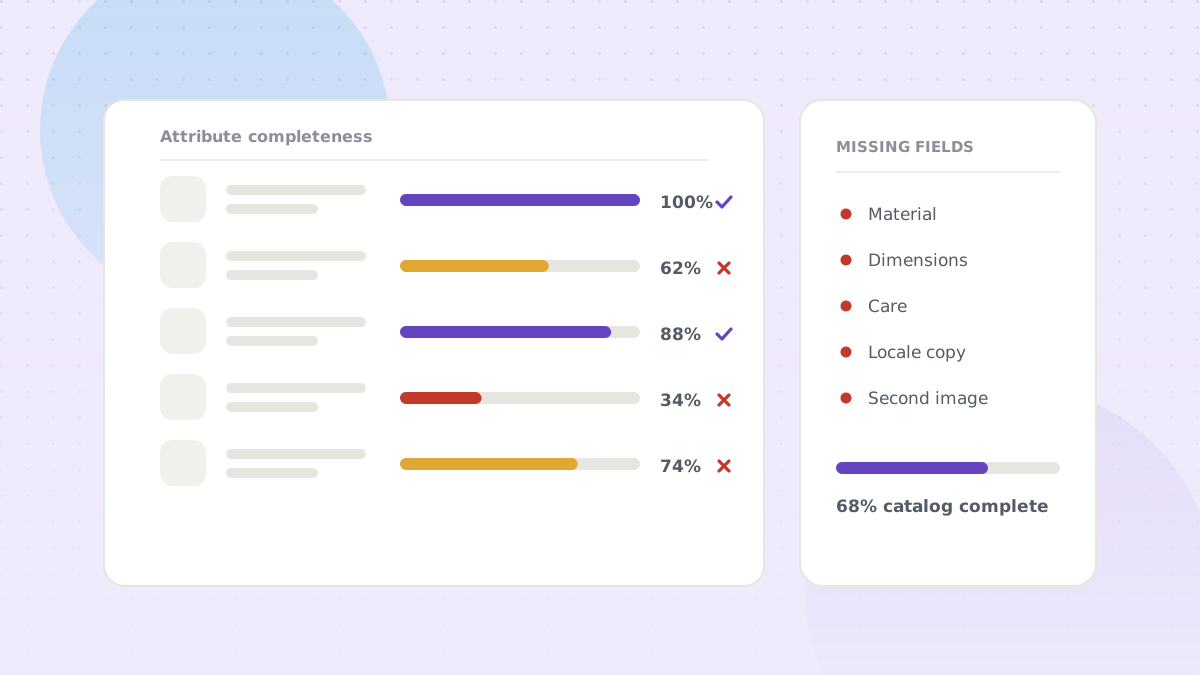
Completeness by attribute, by category. What percentage of products in each category have each attribute populated? This immediately shows which refinements you cannot trust.
Consistency of controlled values. How many distinct values exist in an attribute that should have twelve? Sort by frequency; the long tail is your normalization work list.
Description quality. Length distribution, duplicate detection across products, presence of supplier boilerplate. Identical descriptions across variants are both a shopper problem and a search problem.
Image coverage. Products below the category’s image standard, and images that fail to resolve at each view type.
Locale coverage. For each localized attribute, the fill rate per locale. This is usually the worst number in the report and the easiest to act on.
Freshness. When was this product’s data last meaningfully changed? Products untouched for two years in a fast-moving category are usually wrong.
The point of counting is that it makes the problem a backlog rather than a feeling. “Product data needs work” gets deprioritized every quarter. “62% of products in Outerwear have no material attribute, which is why the material filter is useless” gets fixed.
Where the effort pays back
Better product data is not a tidiness project. It pays out in specific places:
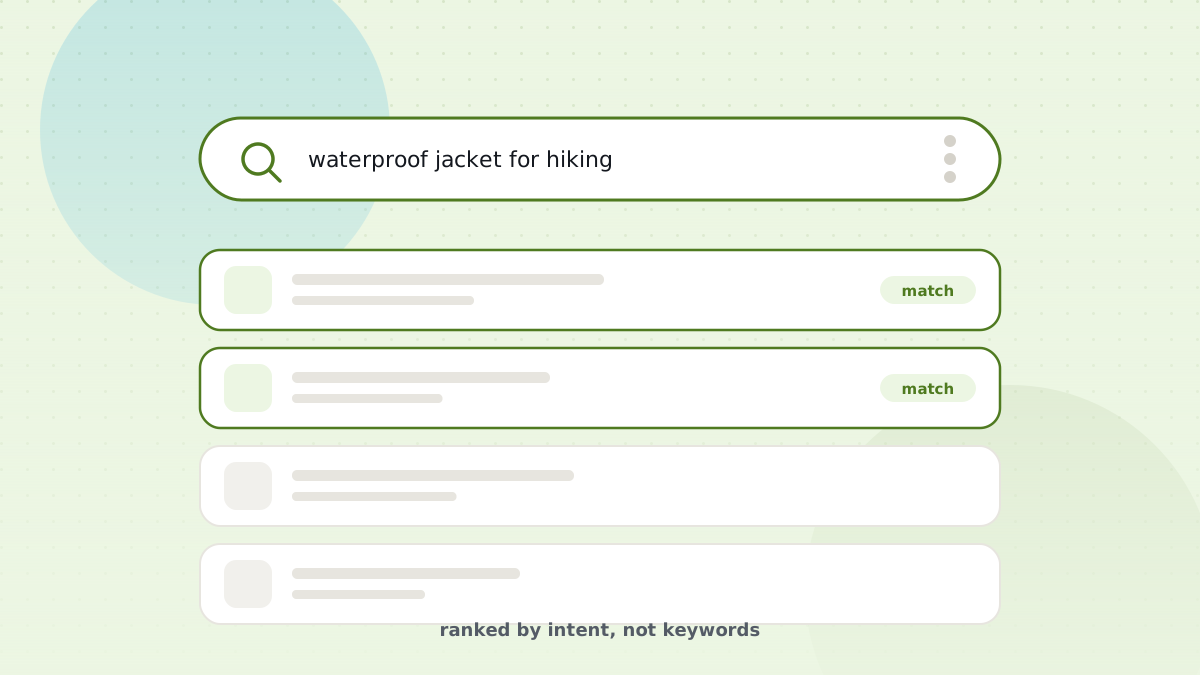
Search and refinement quality. Filters only work on attributes that are populated consistently. Most “our search is bad” complaints are partly a data completeness problem wearing a search costume.
Conversion on the PDP. The questions a description fails to answer become either a support contact or an abandoned session.
Returns. Sizing, dimensions and material accuracy are the cheapest returns reduction available to most retailers.
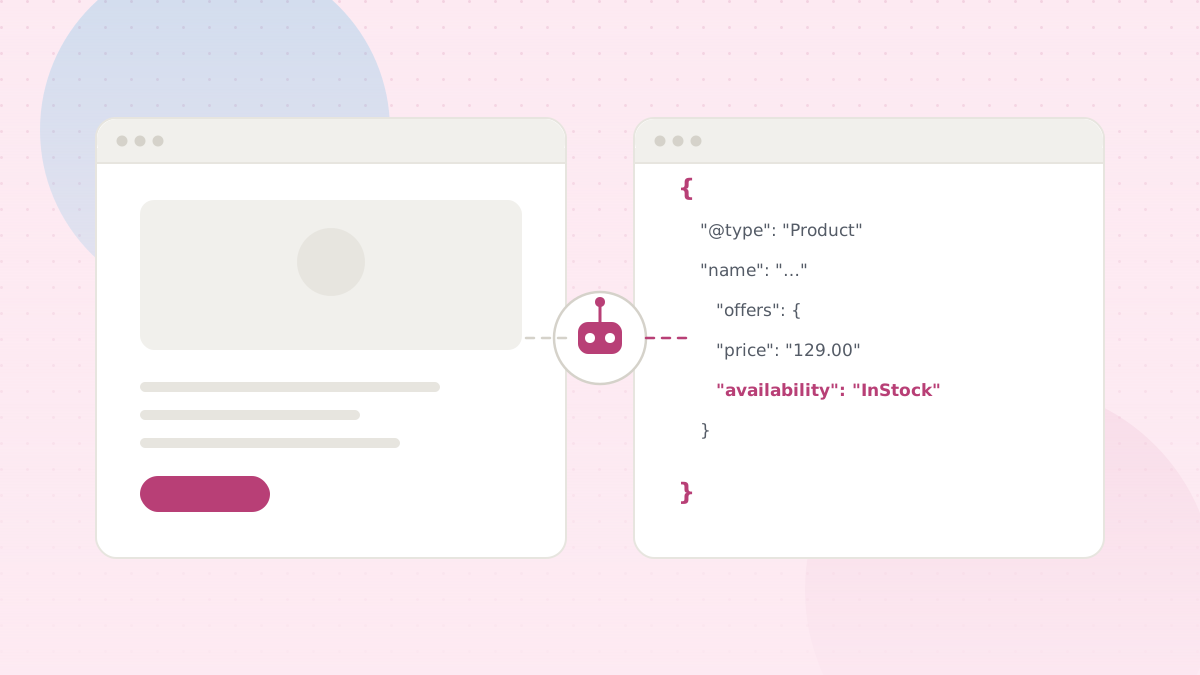
Channel readiness. Marketplaces, comparison engines, ad feeds and AI shopping assistants all consume structured product data, and each has its own required fields. Data that is merely adequate for your own PDP tends to be rejected or ignored elsewhere.
Merchandiser time. Every hour spent hunting for which products are missing what is an hour not spent merchandising.
Doing something about it at scale
Fixing one product in Business Manager is easy. Fixing a category is a project, and fixing a catalog by hand is not a plan. What changes the economics is treating enrichment as a repeatable pipeline rather than an editing task: define what complete means per category, measure against it, normalize the values that should be controlled, generate or draft what can be drafted, and route only the genuinely ambiguous cases to a human.
That is a different kind of work from managing a catalog inside Business Manager — and it is where most of the remaining value in a well-managed catalog is still sitting.