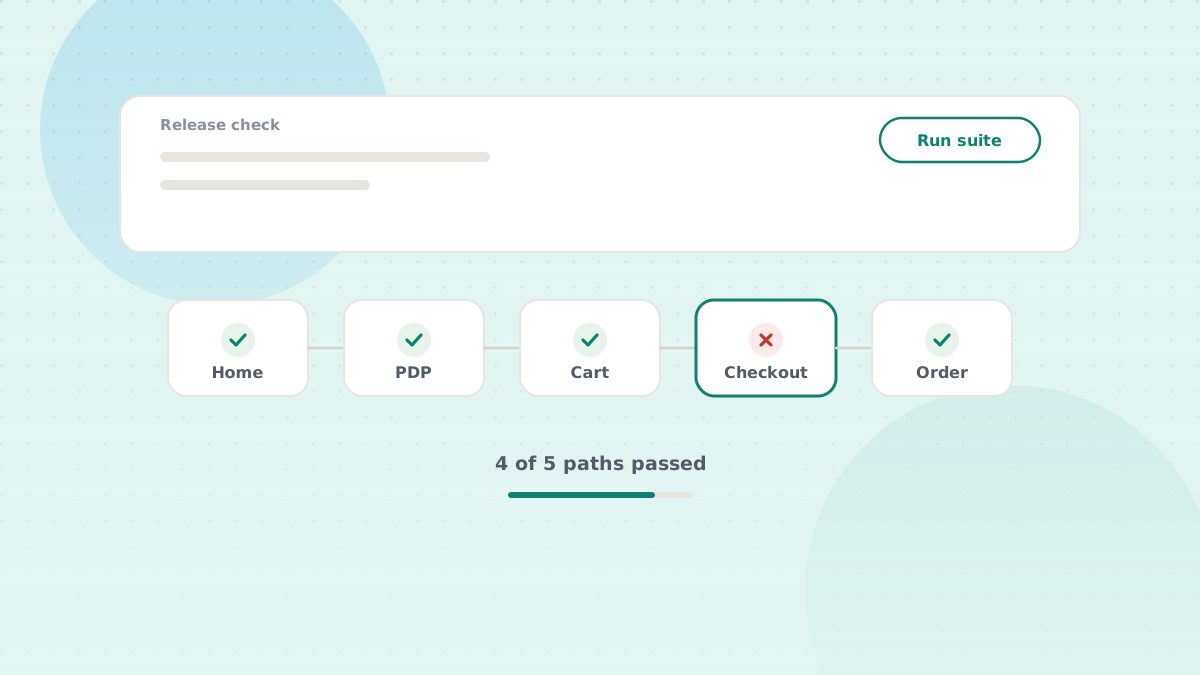
A release ends with a moment of quiet. The code version is active, the smoke test passed, the storefront looks right, and the team moves on to the next ticket.
That quiet is misleading. Everything tested before a release is a hypothesis about how the storefront behaves under real traffic, with real catalogs, real payment volumes and real integrations. Production is where the hypothesis gets tested — and production, unlike your test plan, does not tell you when it fails.
The failures that never reach an error page
Salesforce Commerce Cloud is stable in a way that hides problems. The site stays up, pages render, orders keep flowing. What changes is a number, and unless someone is watching the number, nothing announces it.
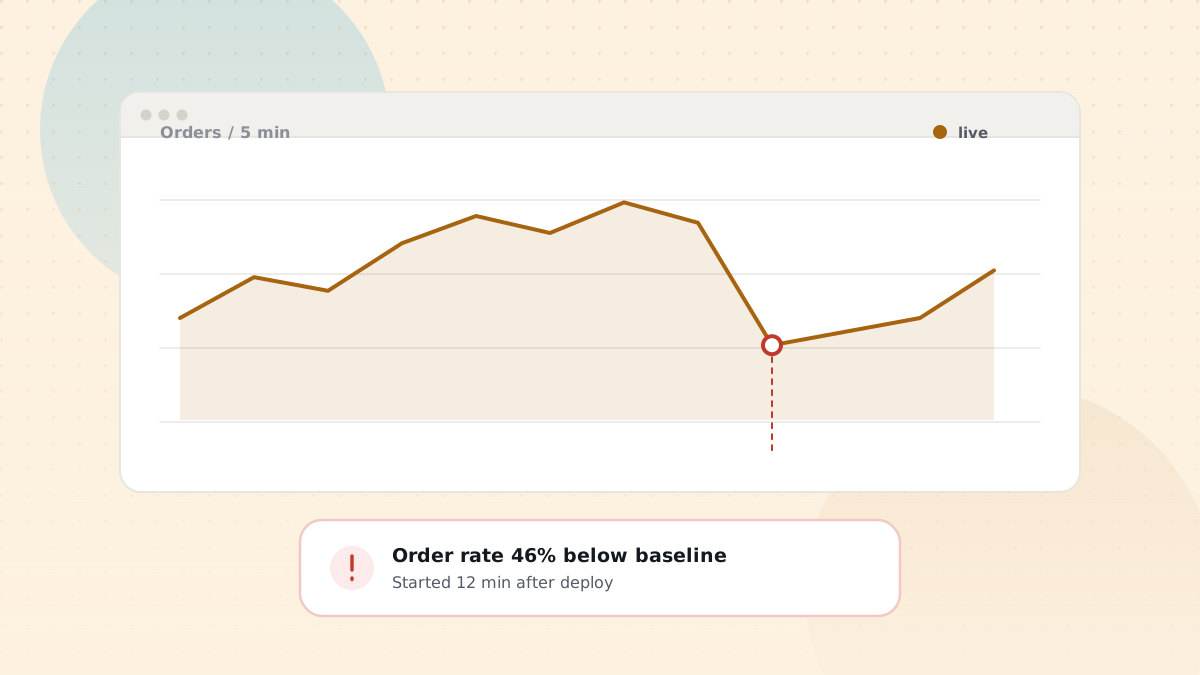
An order flow that partially stops. Not “checkout is broken” — checkout works, but orders from one payment method, one locale or one shipping option stopped completing an hour ago. Total volume dips a few percent. No exception is thrown at anybody.
A job that fails or silently degrades. The nightly inventory feed errors, or worse, succeeds against an empty file. Availability is now wrong across the catalog and the storefront reports it confidently. The job log knows; the job log is not on anyone’s screen at 03:00.
An integration that got slower. A payment, tax or address service starts responding in 4 seconds instead of 400 milliseconds. Nothing errors. Checkout conversion falls, and the storefront looks fine to anyone who tests it while traffic is low.
Data that quietly went wrong. A price book import applies to the wrong site, a promotion qualifier is broader than intended, a search index rebuild half-finishes. Every one of these is invisible in code review and glaring in revenue.
Cache behaviour under real load. A page that is correct on a hard refresh can be served stale, or personalized content can be cached and shown to the wrong shopper. This class of bug essentially only appears with real traffic and real cache pressure.
The common thread: the system is functioning. It is producing wrong outcomes efficiently.
Where teams look first, and why it is not enough
The usual answer is the tools already at hand. Business Manager job history for failures. Log files for exceptions. Analytics for traffic and conversion. The platform’s own performance dashboards.
Each of these works, and each has the same weakness: it is pull, not push. Somebody has to go and look. That happens reliably for a day or two after a release, then attention moves on. The gap between “the data existed” and “somebody saw it” is where incidents grow from a bad hour to a bad week.
The second weakness is that the signals sit in different places. Job status is in one screen, exceptions in log files, order volume in analytics, service latency somewhere else entirely. Diagnosing a real incident means correlating them by hand, under pressure, usually while someone from the business asks for an update every ten minutes.
What is actually worth watching
You do not need to monitor everything. A small set of signals catches most of what matters:
Order flow rate. Orders per interval, compared against the same interval on a normal day, split by payment method and site. This one number catches more real incidents than any other.
Job outcomes. Not only failures — durations and record counts too. A job that finished in 40 seconds when it usually takes 12 minutes did not succeed, it did nothing.
Integration health. Error rate and latency for each service the storefront depends on at checkout. Degradation matters as much as outage.
Catalog and pricing sanity. Counts of products online, products without prices, products without images, products missing from the index. Sudden movements in any of these are almost always an import that went wrong.
Search index freshness. When each index last completed, and whether it completed fully.
Error rate by page type. Rising 500s on PDP or checkout, specifically, rather than an overall average that averages away the thing you need to see.
Turning signals into a response
Data that nobody is paged about is documentation, not monitoring. Three things turn a signal into an actual safety net:
A baseline. “12 orders in the last five minutes” means nothing without knowing that Tuesday at 14:00 usually produces 40. Thresholds that ignore normal seasonality either scream constantly or never fire.
A route to a human. Every alert needs a named owner and a channel that person actually reads. An alert that lands in an inbox nobody opens is worse than no alert, because it creates the belief that someone is watching.
A tie back to the release. The most useful question during an incident is “what changed?” — code version, data import, preference, job schedule. If your monitoring can be lined up against your deployment timeline, most investigations end in minutes instead of hours.
Deployment is the middle of the story, not the end. Development, testing and release get a change into production; what happens next is a different discipline, with different signals and a different clock — and it runs continuously, not once per release.